Aurigo Engage
UX Design

THE PRODUCT
︎
Aurigo Engage is a SaaS solution offering an efficient solution for capturing public feedback during infrastructure capital planning, utilizing AI to streamline the typically slow and manual process. The online tool provides an interactive public portal for sharing plans, enabling better insights using sentiment analysis, early incorporation of feedback, and enhanced trust in the process while ensuring compliance with federal, state, and local requirements.
THE TEAM:
Deepa Srinivasan
Bianca Srivastava
MY ROLE:
UX Designer
WHY?
︎
The slow and manual nature of traditional public feedback methods was further exacerbated by the COVID-19 pandemic, requiring a digital do-over. We wanted to create a platform that encpsulated all the nuances of public sentiment traditionally gathered in person, online, to better inform upcoming infrastructure projects and the communities they affect.
THE PROBLEM
︎
Socioeconomic representation had to be captured in order to gather accurate, weighted sentiment analysis.
Projects had to be laid out geographically for voting participants to correctly identify which projects affected them in the near and
projected future.
projected future.
Campaign managers needed a way to clearly advertise projects in order to recieve public opinion.
HOW DID WE MAKE THIS HAPPEN?
︎
REQUIREMENTS
The project team wanted the Aurigo Engage SAAS solution to address the following needs:
︎︎︎A way for consituents to view current and future projects, comment and rate campaigns in their area.
︎︎︎A way for campaign managers to publish projects, and advertise to the broader community that projects are open for public comment.
︎︎︎A way for campaign managers to view public sentiment gathered and consume this information in a digestible manner.
︎︎︎A way to gather top insights in a one page report that highlights overall sentiment, sentiment by geography and demographic and an analysis of sentiment gathered from community comments.
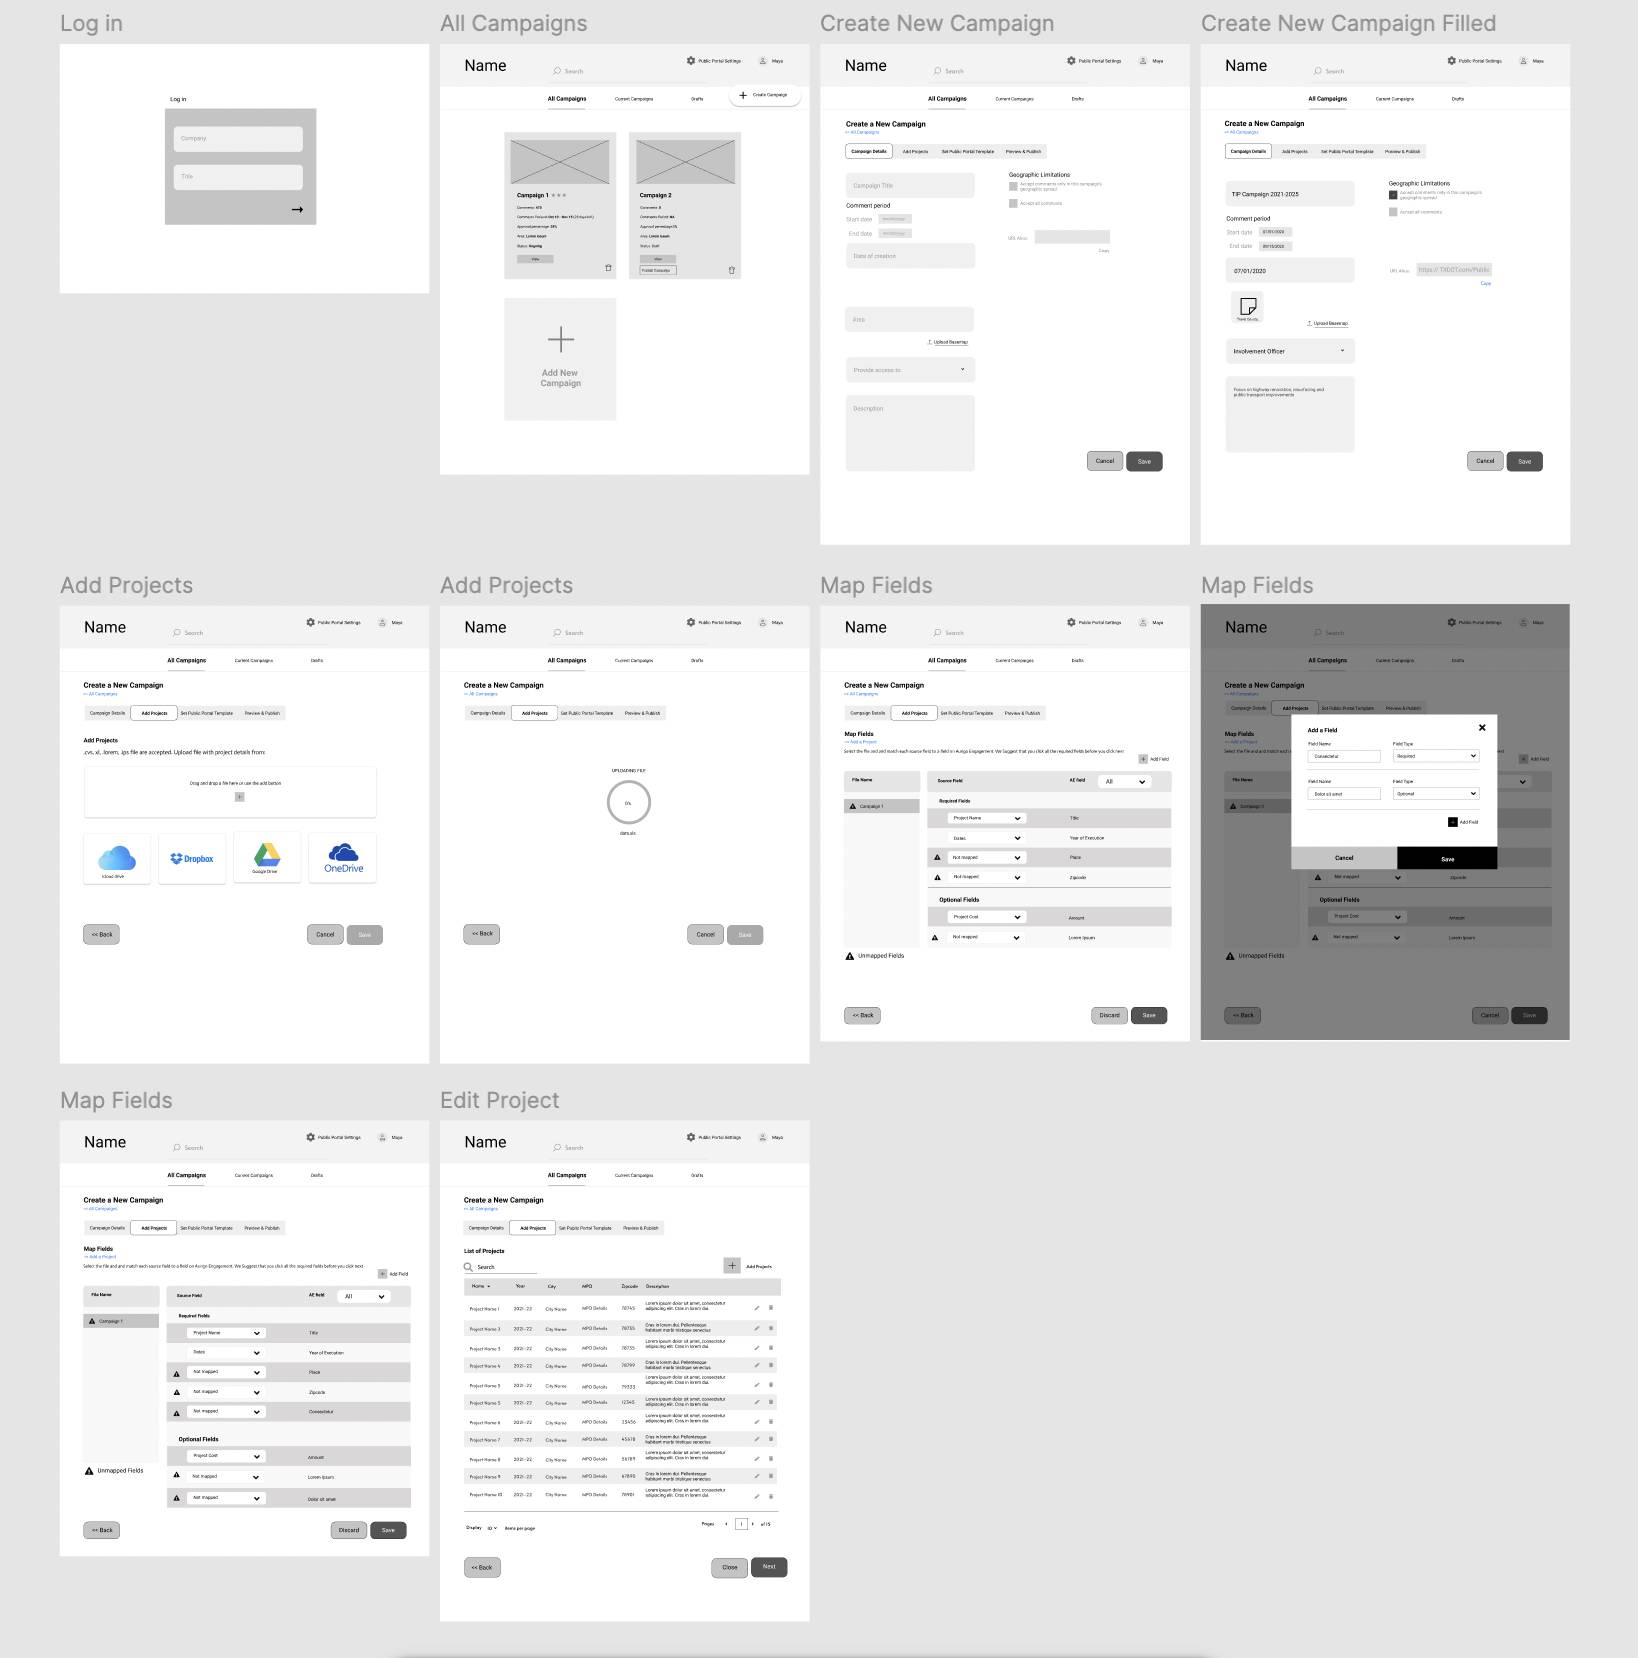
Create campaigns and publish projects
Campaign managers can create new campaigns and upload projects per campaign that will auto populate fields. Users can view, edit and add fields based on their needs. Each campain can include up to 100 projects.
Public Sentiment Dashboard
Teams get an overview of the campaign, with an average 5 star rating of the ongoing sentiment. Teams can view the highest and lowest rated projects, where geographically the comments are coming from and a sentiment map of the comments, designated by green (positive), yellow (neutral) and red zones (negative). Teams also can see the sentiment breakdown over time, in case they have made edits to projects while they’ve been published. Finally, teams can sort through comments by top and lowest rated comments, along with a word cloud which retirieves the most commonly used words in comments.


Public Portal
Campaign managers can determine certain public portal form fields and add custom fields. They also have control over certain template modifications to match their company’s branding.
The public facing portal displays the various projects occuring currently and planned for the future on an interactive GIS map. When selected, the section affected by the project is highlighted in blue and the user can leave a thought about the project, along with a star rating to gather public sentiment.
Reports
Managers can create reports based on sentiment outcomes. They have the option to create comment summaries, project specific outcomes or custom reports. All reports created are saved within the reports functionality.

FINAL SCREENS
︎
Community members can directly vote on the interactive GIS map for current and future infrastructure projects in their area.
They are able to rate the project and offer comments if they have outstanding opinions on the campaign. Comments and ratings work together to create an informed sentiment analysis on projects
and campaigns.


Campaign managers can view the average sentiment, number of comments, approval rating and general details per project at a glance in the list view, as well as filter through projects to get a focused view. This allows campaign teams to quickly identify and focus on their biggest gaps.
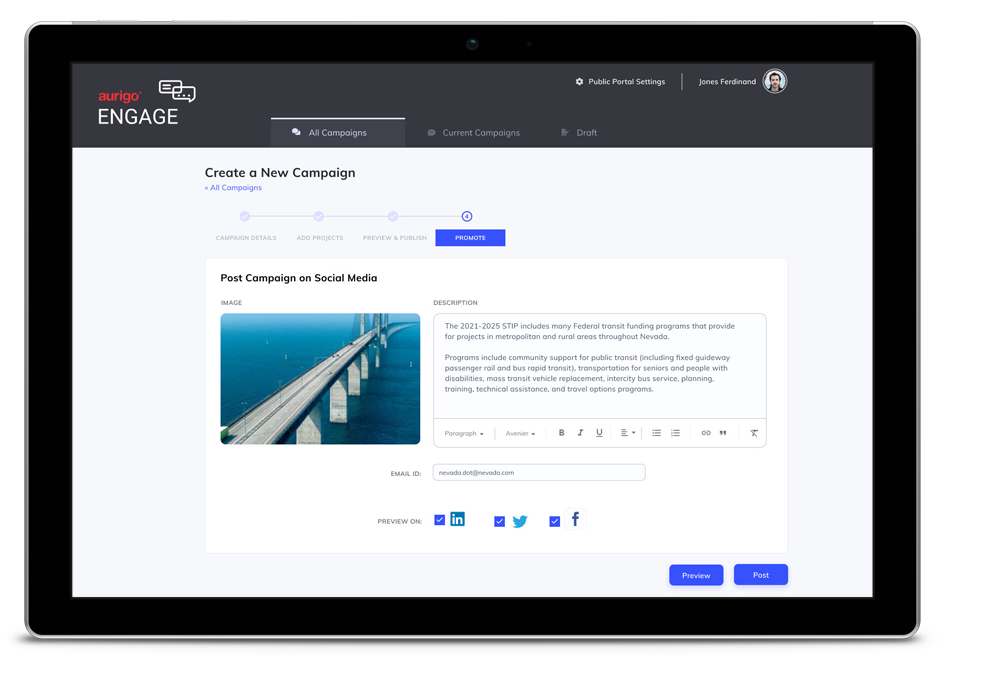
Campaign managers are able to create and promote campaigns on various social media applications using a 4 step process in order to expand their reach to a wider audience of constituents, effectively soliciting feedback.

The dashboard view provides campaign managers with a sentiment overview over time, distribution over the region to ensure diversity in public voting, public rating score and comment disposition.